Performance Tuning SQL Server: Hardware Architectures Throughput Analysis

July 21, 2013

Over the last few years I have performed many SQL Server Data Warehouse Database Performance Tuning Sessions with a variety of customers in many different environments. This sessions usually consist of a weeklong engagement in which I lead an in-depth software (SQL Server) and hardware tuning classes. The results of which are put into a highly detailed roadmap and list recommendations for improved SQL Server Data Warehouse performance.

As part of this testing, I use SQLIO to benchmark the hardware performance capabilities of the SQL Server Data Warehouse database server that I am testing (see: Data Warehouse Storage Throughput (MB/sec) ). There are of course many other types of tests and analyses that I preform as well as part of this week long process but I am going to stick with SQLIO for now.

Since I have performed these tests many times I would like to share some of the results that I have seen from various customer SQL Server Data Warehouse server environments.

Note: Even though these are actual aggregate figures from actual customers, given the complexity of each environment, your results may vary. This is meant to give you an idea what kind of performance to expect.

QSDW: QuickStart Data Warehouse 1000, This is a Dell Microsoft SQL Data Warehouse Appliance that is built to Microsoft FastTrack Reference Architecture Best Practices such as parallelism.

DAS – SSD: Direct Attach Storage with Solid State Drives. SSDs not architected for Data Warehouse specific workloads.

SAN – SSD/HDD: Tier 1 SAN that uses a combination of Solid State Drives (SSD) and Hard Disk Drives (HDD). Not architected for Data Warehouse specific workloads.

SAN – HDD: Tier 2 SAN that uses only Hard Disks Drives (HDD). Not architected for Data Warehouse specific workloads.

Laptop: My personal Laptop with one 7.2 K HDD

image

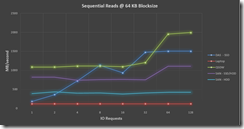
As can be determined from the graph the Dell QuickStart Data Warehouse out preforms even Solid
State Devices and both types of SANs. This due primarily to the fact that the QSDW is specifically tuned to data warehouse workloads which are typically characterized by sequential read/writes in block sizes greater than 64KB. In fact had I increased the block sizes for the tests, the gaps in performance would have increased.

Conclusion:

Ensuring that the Data Warehouse server is specifically tuned for Data Warehouse workloads can have a dramatic impact on performance. In fact this tuning can even be more import than the type of storage technology selected e.g. SAN, SSD, or HDD.

Note: The above graph shows server hardware performance not SQL Server Database Engine performance. The tool SQLIO has nothing to do with SQL Server even though the name might suggest otherwise
Data Warehouse on YouTube

July 12, 2013

I am experimenting with creating a series of Data Warehousing videos. Let me know if these videos are helpful and if you would like to see more.

The videos are loosely based on my PASS and SQL Saturday presentations but go into more detail.

Performance Tuning SQL Server: Parallelism

July 7, 2013

One of the most important architectural principles built into Dell’s latest generation of data warehouse appliances called Quickstart Data Warehouse (QSDW)is parallelism. The following post will give an over of how parallelism can be implement using QSDW as a reference.

Breaking a large data warehouse workload into smaller pieces that then can be worked on in parallel is one of the best ways of scaling SQL Server. This parallel processing technique is exemplified in Non-Uniform Memory Access (NUMA).

Hardware and Software Parallelism

Even though the NUMA architecture is used to create parallelism between main memory (RAM) the server’s CPU cores, the same principle can be applied to the entire SQL Server Data Warehouse Server as well.

However this parallelism is not present in most OLTP systems because those systems rely on a few LUNs/Disk Groups with many disks each to achieve maximum IOPs. While this approach is good for OLTP systems it is not the proper architecture for a SQL Server Data Warehouse Server which seeks to maximize MB/second not IOPS.

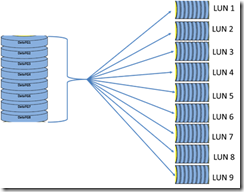
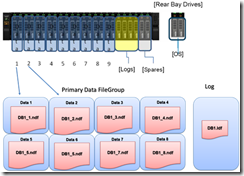
The best approach, therefore, is break up the disks into several separate Disk Groups or LUNs and place a SQL Server database file on each LUN. When this is done the SQL Server Database Engine can break the read and write operations into smaller chunks according to the number LUNs that were created thus achieving parallelism. The image below shows have 9 LUNs can be created and have a SQL Server Database file put on each LUN.

image

Because the data for the entire Filegroup/Database is broken  out to to multiple LUNs by placing a SQL Server database file on each LUN, all database operations will be parallelized. This has the added effect of increasing MB/sec by a factor roughly equal to the number of LUNs, in this case eight.

This architecture does create parallelism a the disk/database level, however it is not yet aligned to the number CPU cores present on the Data Warehouse Server. To accomplish this next level of parallelism, instead of creating one Filegroup for the data base, the number of Filegroups will have to align to the number of CPU cores.

The illustration below demonstrates what the configuration may look like on a server with eight cores.

image

Physically each LUN is implemented on Windows server as a Mounted Volume and each mounted volume will have eight database files, one database file for each of the eight file groups.

clip_image005

Only now can the SQL Server Data Warehouse Workload be parallelized across the entire server, from disks to the each CPU core. While this approach might seem like a lot of work, the performance benefits are tremendous and lead to much more reliable and consistent performance under a wide variety of data warehouse workload scenarios.

The parallelism techniques described above are built directly into Dell Quickstart Data Warehouse Appliance (QSDW), thus making it a highly tuned SQL Server Data Warehouse solution that can save a customer significant time and money.

DQS Composite Domains

June 16, 2013

Update:

I  felt a little too ambitious and actually recorded a series of 3 videos at MSBI Academy which cover all the content of this post. The videos also give a little bit more back ground information about DQS for those who have not used it yet.

1. Creating a new Data Quality Services (DQS) Domain

2. Adding Business Rules to a Data Quality Services (DQS) Domain

3. Enriching data using a Data Quality Services Project

Introduction:

Data Quality Services (DQS) is a great addition to SQL Server 2012. There were many times in the past were I had wished there was a tool which allowed Data Stewards to clean , validate, and preform matching or de-duplication on the data before it went into the Data Warehouse. In my opinion there are only two kinds of companies: those that don’t recognize that they have data quality issues and those that realize that they have data quality issues! Unfortunately, most organizations don’t find out that they have data quality issues until they attempt a data warehouse project and then those issues become all too apparent.

I am not going to go into all the functional details of DQS. (See above link for great training materials on the DQS team website) However, I want to focus on one of the most important features of DQS that seems to be misunderstood.

The ability to create Composite Domains for data correction or validation is one of the most critical features of DQS and would be required in virtually any DQS solution. However, creating Composite Domain rules in the DQS client UI can be a little tricky if you don’t know what to look for. (At least it was for me hence the reason for this post)

The following example uses the AdventureWorks Sample that is available on the DQS Team website. I suggest that you watch their training videos so that you have a good understanding of what I will describe in the next section.

Scenario:

You want to create Composite Domain rules that populates Title based on the values in Marital Status and Gender such that;

when Gender = ‘M’ male

– then Title = ‘Mr.’, or

when Marital Status = ‘S’ single and Gender = ‘F’ female

– then Title = ‘Ms.’ , or

Marital Status = ‘M’ single and Gender = ‘F’ male

– then Title = ‘Mrs.’

clip_image001

To accomplish this first you need to create all the individual domains and then create the ‘Title Enrichment’ Composite Domain. Next the Tile Enrichment Composite Domain needs a few rules to correctly populate the Title domain/column.

For the Single Female Title rule the first part of the rule or the test condition needs to be created. This is similar to the “IF” of the “IF…THEN…” syntax.

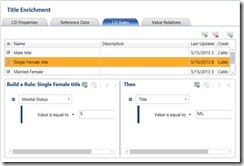
In the following example shows: if Marital Status = ‘S’ then Title = ‘Ms.’

clip_image003

Everything looks good at this point. Now all that is needed is to add an additional condition to the ‘IF’ to test when Gender = ‘F’. However, when you click on the “Adds new condition to the selected clause” button, a new clause is created for the Marital Status domain.

clip_image005

This not what is needed because the Gender domain needs to be used. It would appear that DQS is missing the very important ability to have multiple domains be tested in the same Composite Domain Rule.

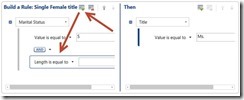
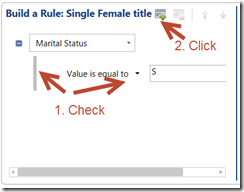
The key to creating this type of Composite Domain Rule is to ensure that that no part of the current condition (“Martial Status Value is equal to S”) is in focus when you click on the “Add new condition to the selected clause”. You will know when the current condition is in focus because the vertical line will be solid blue or a blue box will around a part of the condition. See below:

clip_image007

What is required is to; 1. Click away for the part of the current condition before 2. You click on the “Add new condition to the selected clause”

clip_image008

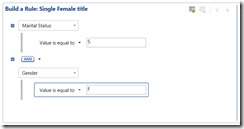
If you do that then you can create the required condition using the Gender domain

clip_image009

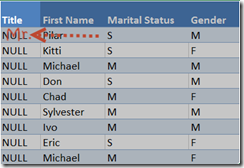
Now when a project is run with this Composite Domain and the data in the Title column will have the correct values:

clip_image011

BlueGranite: DW and BI Resources

June 9, 2013

image

BlueGranite, a company that I do a lot work for and who has a great team of BI and DW professionals, are creating great BLOG posts that will be useful for those who are not  in-the-weeds developers, such as self Smile

untitled

Another great resource is Rob Ker’s (SQL MVP) MSBI Academy which some good short videos on great variety of Microsoft BI topics. I like his videos because they get to the point and have much better sound quality. No more having to sit through long demos that ramble on and at times are very hard to understand. (I have been known to do that from time to time)

To be completely transparent I will be creating some content for these sites as well. You might even see content there before it appears in my BLOG.

Example:

My SQL Performance Tuning Test Results for Data Warehouse Architectures post compiles over a year’s worth of SQLIO work with variety of SQL Server Data Warehouse Hardware Architectures.

I also like Rob’s Big Data Series

And in case you missed TechEd North America 2013 here are my top picks:

Any Data, Any Size: Architecting Breakthrough Performance with Mission Critical Solutions Built on HP AppSystem for Parallel Data Warehouse

Do You Have Big Data? (Most Likely!)

Large-Scale Data Warehousing and Big Data with Microsoft SQL Server Parallel Data Warehouse V2

Polybase: Hadoop Integration in SQL Server PDW V2

What’s New for Columnstore Indexes and Batch Mode Processing

Performance Tuning SQL Server Database: Extended Events

June 2, 2013

Extended Events are not new to SQL Server 2012 but they have been greatly enhanced from when they were first introduced in SQL 2008. As is my style, I am not going go into to a long protracted discussion of extended events. That is what MSDN is for and they do good job of covering all the details there.

What I am going to focus on is how Extended Events can be used in data warehousing. To begin with, Extended Events (XEvent) can be incredibly valuable for data warehouse scenarios because it can measure the throughput (MB/sec) for each query executed against the data warehouse server. Knowing the throughput requirements (MB/sec) of the date warehouse queries is absolutely critical for architecting a data warehouse server that preforms as expected! See: Data Warehouse Storage Throughput (MB/sec) for more information.

If for example you know that a data warehouse query returns 2,000 MB and that the users want the query to complete in 10 seconds, and assuming that the query takes 5 seconds to aggregate on the CPU, then you know that the minimum required throughput should be 400 MB/sec:

Example:

Query MB / seconds required

2,000 / 5 = 400 MB/sec

Note: The above does not account for concurrence (number of users and the other queries running at the same time on the server which will have to be accounted for as well).

You can use IO Statistics to measure a query’s MB as explained here: Page Compression, but that is tedious to do for a lot of queries and doesn’t give a good idea of the other queries running on the server as well. Now enter Extended Events, with extended events you create a session get all that information plus much more.

Example:

1. Create an Extended Events session with the following actions:

CREATEEVENTSESSIONQueryIOStats2012

ONSERVER

ADDEVENTsqlserver.sql_statement_completed

  (ACTION (sqlserver.database_id,

           sqlserver.sql_text,

                sqlserver.nt_username,

                sqlserver.session_id,

                sqlserver.query_hash,

                sqlserver.query_plan_hash)

    )

ADDTARGETpackage0.asynchronous_file_target(SETfilename=N’c:\temp\QueryIOStats2012.xel’)

WITH (MAX_DISPATCH_LATENCY= 5 SECONDS);


Note: I choose to save the results to an xml file instead of keeping them in memory because they can get very large, depending on how active your server is.

2. You then let the session run for the period of time that you want to collect query data for and with a little bit of knowledge about querying xml you have access to a wealth of knowledge.

select

       a.LogTime

       ,DATEPART(DAY,a.LogTime)asDay

       ,DATEPART(hour,a.LogTime)asHour

       ,a.Duration/1000000.00 asDurationSec

       ,a.CPUTime/1000000.00  asCPUSec

       ,a.PhysicalReads

       ,a.LogicalReads

       ,a.Writes

       ,a.PhysicalReads*8/1024.00   asPhysicalReadsMB

       ,a.LogicalReads*8/1024.00   asLogicalReadsMB

       ,a.Writes*8/1024.00  asWritesMB

from (

SELECT

    EventLog.value(‘(/event[@name=”sql_statement_completed”]/@timestamp)[1]’,

                     ‘datetime’)ASLogTime,

       EventLog.value(‘(/event/data[@name=”duration”]/value)[1]’,

                     ‘int’)ASDuration,

       EventLog.value(‘(/event/data[@name=”cpu_time”]/value)[1]’,

                     ‘int’)ASCPUTime,

       EventLog.value(‘(/event/data[@name=”physical_reads”]/value)[1]’,

                     ‘int’)ASPhysicalReads,

     EventLog.value(‘(/event/data[@name=”logical_reads”]/value)[1]’,

                     ‘int’)ASLogicalReads,

       EventLog.value(‘(/event/data[@name=”writes”]/value)[1]’,

                     ‘int’)ASWrites,

     EventLog.value(‘(/event/action[@name=”sql_text”]/value)[1]’,

                     ‘varchar(max)’)ASSQLText,

       EventLog.value(‘(/event/action[@name=”session_id”]/value)[1]’,

                     ‘varchar(max)’)ASSession_ID,

       EventLog.value(‘(/event/action[@name=”nt_username”]/value)[1]’,

                     ‘varchar(max)’)ASNTUsername,

       EventLog.value(‘(/event/action[@name=”query_hash”]/value)[1]’,

                     ‘varchar(max)’)ASQueryHash,

       EventLog.value(‘(/event/action[@name=”query_plan_hash”]/value)[1]’,

                     ‘varchar(max)’)ASQueryPlanHash             

FROM (

SELECTCAST(event_dataASXML)ASEventLog

       FROMsys.fn_xe_file_target_read_file

       (‘c:\temp\QueryIOStats2012*.xel’,null,NULL,NULL))asLogRecords

)asa

orderbya.LogTime

;


<rant> yeah I know querying xml makes my brain hurt too, but it is so worth it !!!</rant>


Results:

image

With these results you can now analyze the query patterns aggregated by a certain time interval (hours by day) and compare that to actual hardware IO limitations as measures by SQLIO. You can now answer difficult questions like the following with confidence:

How will the date warehouse server preform if I add X amount of data?

What are the largest queries and peak query times?

Will my data warehouse perform well if I add X amount of users?   

Is my ETL taking too long because of lack of server resources or slow ETL logic?

 There is so much more that can be learned from the above extended event xml query, such as query and query plan hash but I hope that this gives you an idea of what is possible.

Script

SQL Server Data Warehouse Database Performance: L1 L2 and L3 caches

May 19, 2013

I recently upgraded the OS on my laptop to windows 8 and there are things that I like and things that I don’t like about it. I think that most of the things that don’t like have more to do with some of the new navigation features and should become second nature over time.

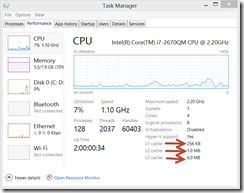
One of my favorite surprises in win8 is the new Task Manager. When I open it up, I am presented with a much cleaner interface that also provides more information than the previous versions of Task Manager. One these new goodies is now you can see the sizes of the L1, L2, and L3 caches:

clip_image001

These CPU caches act like stepping stones for data as it travels from main memory (RAM) to the CPU and the closer the cache is to the CPU the faster the data can be processed by the CPU. For example L1 and L2 caches are orders of magnitude faster than the L3 cache and as you can tell from the above image the closer the cache is to the CPU (L1) the smaller the cache size is.

If you have an application that you want to process faster on the SQL Server 2012 CPU then a good way to do it would be to have the application divide up its instructions and data into batches that would ideally fit in the L1 or L2 caches. Then magically your application would run faster (there is more to it than just that but I am keeping things simple).

Well that is great but what do L1, L2, and L3 caches have to with SQL Server databases and data warehousing? Well in a word ALOT! The new SQL Server 2012 Columnstore Indexes not only compress and store data (tables and indexes) in a column-wise format but this columnar data is also broken down into “batches” that just so happen to match the sizes of the L1 and L2 caches on the SQL Server 2012 Data Warehouse Database Server. This means that all things being equal, the same data set will actually process faster on the SQL Server 2012 Data Warehouse Database Server CPU using Columnstore Index’s data “batches” than had the same data been processed without Columnstore Indexes.

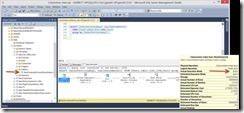
And guess what, you can actually see this happen in SQL Server Management Studio SSMS when you run query on a tables that has a SQL Server 2012  Columnstore Index and view the Execution Plan.

Example:

clip_image003

The table dbo.CSI_100m_Fact has a SQL Server 2012 Columnstore Index and at execution time the query uses Actual Execution Mode = BATCH for the SQL Server 2012 Columnstore Index Scan operator which mean that it is doing its L1 and L2 magic behind the scenes and your queries now run much faster!

Note: If you create a columnstore index on your SQL Server 2012 database and your SQL 2012 data warehouse database query does not use the columnstore index then that means that your data model is wrong (fact and dimension tables) or your query does not match typical data warehouse workloads. See: Columnstore Indexes on MSDN.

SQL Server Database Performance Tuning: Table Partitioning with Fact Tables

May 5, 2013

 Table partitioning for SQL Server database fact tables is one of the best ways to improve processing for fact data loads during the ETL process and it also can dramatically improve query response time as well. SQL Server Table partitioning should be used on all but the most trivial database fact tables (and even then I would still use it). However, despite its great advantages and the fact that it has been around since SQL Server 2005, I still find it under-utilized.

Database table partitioning compliments Kimball Style Transaction or Snapshot Fact tables very nicely (See Slowly Changing Facts).  In SQL Server 2012 the number of possible partitions per table has even been increase to 15,000! This great news because that means if you partition your database fact table by days it could hold more than 40 years’ worth of data without changing the partition scheme !!! And if the database fact table is loaded nightly with a single day’s data then SQL Server database table partition switching becomes a breeze.

I won’t go into all the details but  SQL Server database table partition switching allows inserts and deletes to a partitioned database fact tables, no matter how large, to occur almost instantly. Updates can occur orders of magnitude faster as well (but I don’t recommend updating fact tables).

Example:

I am not going to go through all the steps. See Script for details

1.      Create two tables and populate them with data:

1 .     dbo.TablePatitionDemoFact – holds historical fact data

2.      dbo.TablePatitionDemoFact_switch  –  simulates new rows to be loaded into fact table from nightly ETL process


2.      selectmax([OrderDateKey])asTablePartitionDemoFact

3.      fromTablePartitionDemoFact

4.      unionselectcount(1)fromTablePartitionDemoFact

5.       

6.       

7.      selectdistinct[OrderDateKey]  asTablePartitionDemoFact_switch

8.      fromTest.dbo.TablePartitionDemoFact_switch

9.      unionselectcount(1)fromTablePartitionDemoFact


TablePartitionDemoFact:

      60398 – rows

      20040731 – max transaction date

TablePartitionDemoFact_switch:

     60398 – rows

     20040801 – max transaction date


Both tables have about 60,000 rows but the _switch table has rows that need to be inserted in the fact.

2. To switch the rows  by simply using the Alter Table… switch command

ALTERTABLE[dbo].[TablePartitionDemoFact_switch]SWITCHPARTITION 2

        TO[dbo].[TablePartitionDemoFact]  PARTITION (2)


Rerun the queries from before and you will see that rows have now been switched to the fact table in < 1 Second!


TablePartitionDemoFact:

    120,796 – row count

    20040801


TablePartitionDemoFact_switch:

    0 


The process can easy be reversed if the data needs to be modified or archive/deleted by simply reversing the tables is the switch command.


ALTERTABLE[dbo].[TablePartitionDemoFact]SWITCHPARTITION 2

        TO[dbo].[TablePartitionDemoFact_switch]  PARTITION (2)


TablePartitionDemoFact:

   60398 – row count

   20040731

TablePartitionDemoFact_switch:

   60398 – row count

   20040801


Note: Both database table schemas must be identical. This includes indexes as well! During the switch process no table or indexes updates are required. There is just a simple pointer/metadata operation and the magic happens almost instantly!


For the purpose of this demo I didn’t create any indexes just to make things simpler but now you might understand why SQL Server 2012 Columnstore Indexes  were not updateable! Because the assumption was that any decently sized  database fact table is already partitioned, so therefore no need to make columnstore indexes updateable.


The best practice is to bulk load the data, in parallel if possible, into the database switch/stage table, using minimal logged transactions. Create the required SQL Server indexes and then simply switch the partitions. It is that simple. This process will perform well on fact tables with billions or even trillions rows!

 Script

Bret Ozar has put together a wonderful list of the most import Table Partitioning Resources

I personally like using SQL Server Partition Management tool from Code Plex

SQL Server Performance Tuning : Slowly Changing Facts?

April 21, 2013

This post is a follow-up to the previous post Update Fact Tables? Recently I have seen people try to convert SQL Server transactional fact tables into quasi-slowly changing transactional fact tables. These quasi-transactional database  fact tables will most likely have something like an EffectiveDate, ExpiryDate and maybe even an IsCurrent indicator columns. Below is a generic representation:

clip_image002

In many cases this done because the measure or fact values change over time and the analyst want not only the most recent values but the historical values as well. While something like the above diagram does address those issues, it does so at a very large cost, which will make the quasi-transactional fact unable preform into the future.

Unless you are told by the source system which fact rows have changed, all the source rows will have to be compared against the latest row versions in the SQL Server Database quasi-Transactional Fact Table. In other words, whether in SSIS (please don’t use SSIS to do this) or on the SQL Server Database Engine, both data sets of fact rows will have to be filter, sorted, joined by some key, and then compared on a column by column basis to find the changes (or you could use Hashbytes, never us Checksum !!!). The new row versions are then inserted and the old row versions have to be updated with new expiry dates.

While this might perform well on a small scale, let’s say with only a few thousand rows, imagine what would happen if the tables were increased to millions, billions, or even trillions of rows. Once you run out of memory things will get very slow very quickly!!

The correct solution is to change the Quasi-Transactional Fact Table into a true Snapshot Fact Table. In my experience too many data warehouse developers don’t understand the difference between these two very important types of fact tables.

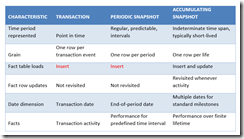
If you have not already done so please read or re-read The Data Warehouse Lifecycle Toolkit. It should be required reading for anyone before they sit down and design their SQL Server data warehouse database. I will not rehearse what that book says because it does such a good job, but I will use one very important chart:

image

Notice that both Transactional and Snapshot Fact Tables are insert only tables.

<rant> Accumulating Snapshot Fact Tables are very rare and I have only used them once in my 10 years of experience. In my experience if you are justifying the update of your fact table by calling it an Accumulating Snapshot you are most likely doing something wrong. </rant>

Now with this knowledge we can go back and convert the original quasi-transactional fact table to a true Snapshot Table.

clip_image004

Some might protest that now that all of the source fact rows are now just inserted every day that the fact table will become huge. To that I say great! You want fact tables with lots of rows. The more rows the better! This is because there are very neat ways of managing large tables like Table Partitioning (see: Table Partitioning and Columnstore Indexes).

SQL Server Database Performance Tuning: Update Fact Tables?

April 7, 2013

I have been asked on several occasions if rows/values in a SQL Server database fact table should be updated. The answer to this question in almost all cases is NO! Fact tables should not be updated. There are several really good reasons why facts measure values should almost never be updated.

1. Consistent Reporting: If I run a report today which reports on last week’s measure values I should get the exact same measure values if I run the same report tomorrow. The end users will not be happy if their historical numbers keep changing every day that they run the report!

2. Fact Table Processing: Preforming updates on tables can be a very costly operation on the SQL Server data warehouse database server! Fact tables can and should be very large. They can contain 100’s millions, billions, or trillions of rows and they should only have one index on each surrogate key column as well (useless you are fortunate enough to have SQL Server 2012 then just create one Columnstore Index which includes all the surrogate keys). All that makes updating anything in a database fact table very costly and should be done with great care and thought.

But I also realize that we also live in the real world. And in the real world sometimes fact transaction measure values change (even though they shouldn’t!!). I won’t name names but there are plenty of source systems which allow fact transaction measure values to be updated. So what can you do? You need to record those changing facts, but you also want to preserve reporting consistency and you don’t what to exponentially increase the time it takes to process the transactional fact table.

Well there are a few options:

1. Covert the transactional fact table to a snapshot fact table (more on that later)

2. Create the ‘Adjustment’ facts in the ETL process and insert them into the Fact table

The second option works especial well if the source systems actually tells you when the fact was last updated i.e. LastUpdatedDate. Personally, I like to create another TransactionType dimension which will hold a member representing the ‘normal’ non-adjusted facts and a member for the ‘adjustment’ facts that have to be created in the ETL. In the end the ERD would look something like the following:

clip_image002

An example scenario using a flatten fact table for simplicity:

Let say that the fact table starts at 01/01/2013 with only 3 transactions (one for each product)

DateKey DimProduct DimTransType Measure
20130101 ProdA normal 100
20130101 ProdB normal 100
20130101 ProdC normal 100

However on 01/02/2013 it was realized that the data entered on 01/01/2013 for ProdA was incorrect and the real value should have been 75. The ETL should hopefully be able to identify the LastUpdatedDate of the transaction and calculate the difference between the historical ‘normal’ value and the new target value. That difference should then be inserted in the fact table as an ‘adjustment’ transaction.

DateKey DimProduct DimTransType Measure
20130101 ProdA normal 100
20130101 ProdB normal 100
20130101 ProdC normal 100
20130101 ProdA adjustment -25

Now normal + adjustment still sums to the correct value of 75 but report consistency can still be preserved because the report or cube can choose to see the fact values with or without the adjustment records. This will also greatly reduce the ETL fact load processing requirements as oppose to just updating the facts in place. Note: having a good table partitioning strategy is critical for large fact tables.

I also like preserving the adjustment date value as well, as that will allow the business can see how far back transactions are being corrected. In many cases I have seen managers shocked by the frequency of these ‘rare’ corrections Smile

DateKey AdjDateKey DimProduct DimTransType Measure
20130101 20130101 ProdA normal 100
20130101 20130101 ProdB normal 100
20130101 20130101 ProdC normal 100
20130101 20130103 ProdA adjustment -25